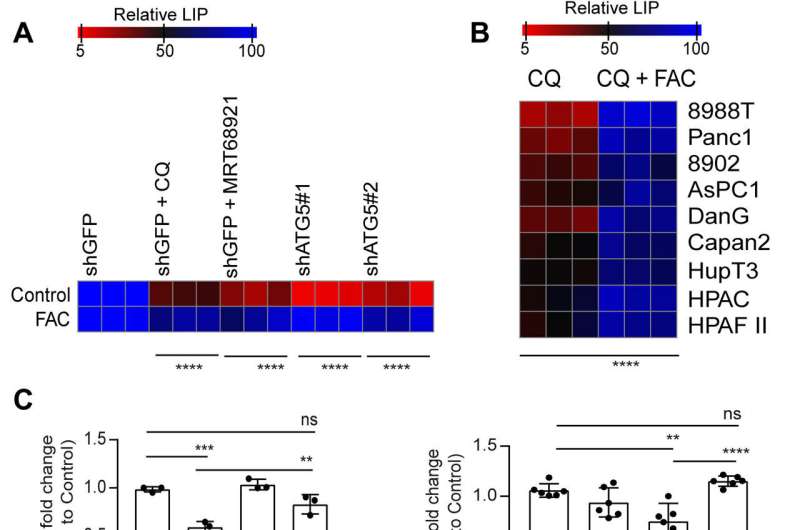
img width="800" height="530" title="Autophagy inhibition leads to a drop in the LIP in PDAC. (A) Autophagy was inhibited genetically or pharmacologically in PDAC cells, and the relative LIP was determined after cotreatment with FAC in 8988T cells. (B) Chloroquine (CQ)–mediated drop in LIP was rescued by FAC in the indicated PDAC cell lines. (C) OCR rescue after FAC cotreatment in CQ-treated or ATG5-knockdown PDAC cells. Heatmaps showing clonogenic assays (D) in PDAC cells and relative proliferation in a panel of PDAC cell lines after treatment with FAC in autophagy-inhibited cells. Data are means ± SD, and P values were quantified using two-way analysis of variance (ANOVA) with Sidak's multiple comparison's test (for A, B, D, and E) and one-way ANOVA with Tukey's post hoc test (for C). **P 0.01, ***P 0.001, and ****P 0.0001 were considered as significant. The heatmaps (A, B, D, and E) as well as OCR data of siATG5 panel (C) are representative of one experiment repeated n = 3 (for heatmaps) and 2 (for OCR) times, respectively, while the OCR data of CQ experiment panel in (C) are combined data from n = 3 experiments. Heatmaps are indicating values in % by considering control as 100. Credit: Science Advances (2023). DOI: 10.1126/sciadv.adf9284" alt="Inhibiting the biological crosstalk of autophagy and mitochondrial function underlying pancreatic ductal adenocarcinoma" src="/Editor/ebioueditorasp/asp/upload/image/20230506/16833364915527982.jpg" 自噬抑制导致PDAC中LIP下降
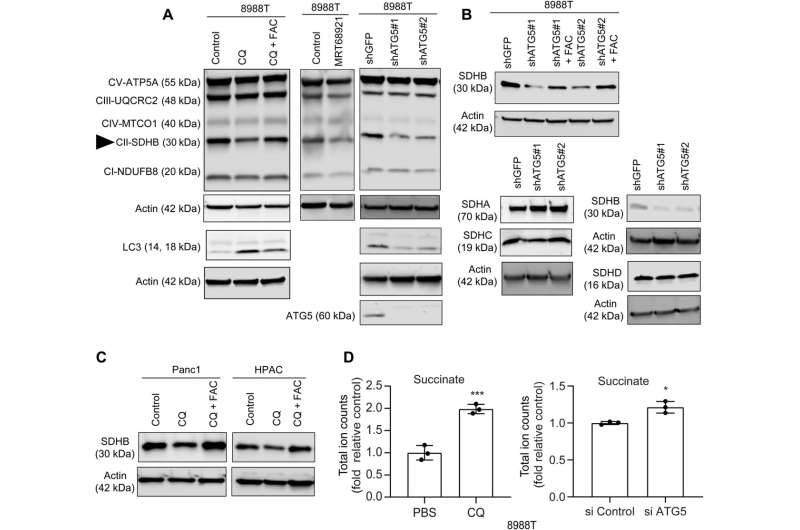
img title="Autophagy inhibition abrogates SDHB level in PDAC. Pharmacological (A) or genetic (B) inhibition of autophagy in PDAC cells was cotreated with FAC for 24 hours followed by immunoblots for the indicated proteins. SDHB is pointed out using a triangle. Similar to (A), other PDAC cell lines were used for analyzing SDHB level in (C) followed by total ion counts of succinate in PDAC cells using liquid chromatography–mass spectrometry (n = 3 technical replicates) after autophagy inhibition (D). Data are means ± SD, and P values were quantified using unpaired Student's two tailed t test. *P 0.05 and ***P 0.001 were considered as significant. Credit: Science Advances (2023). DOI: 10.1126/sciadv.adf9284" alt="Inhibiting the biological crosstalk of autophagy and mitochondrial function underlying pancreatic ductal adenocarcinoma" src="/Editor/ebioueditorasp/asp/upload/image/20230506/16833364927771077.jpg" 自噬抑制可消除PDAC中的SDHB水平
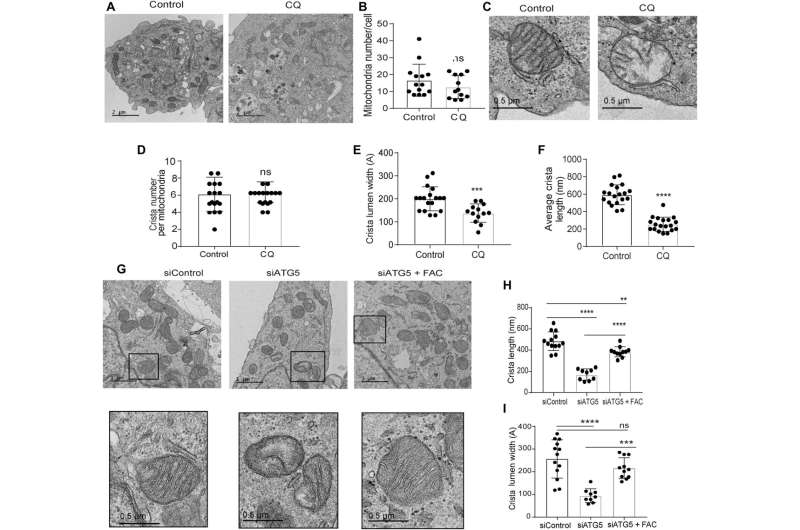
img title="Loss of autophagy impairs mitochondrial microarchitecture in PDAC. (A) Representative TEM images of PDAC cells treated with PBS (Control) or CQ followed by determining their (B) mitochondrial number per cell (Control, n = 14; CQ, n = 12 cells). (C) A magnified section of a PDAC cell showing mitochondrial ultrastructure after CQ treatment followed by quantification of (D) crista number per mitochondria (n = 17 unique crista for both Control and CQ), (E) crista lumen width (Control, n = 18; CQ, n = 13 unique crista), and (F) crista length (n = 19 unique crista for both Control and CQ). (G) Representative TEM images of ATG5-knockdown PDAC cells with or without FAC treatment were quantified for (H) crista length and (I) crista lumen width (siControl, n = 13; siATG5, n = 9; siATG5 + FAC, n = 11 unique crista). Black boxes were digitally zoomed in to highlight the morphology of typical dysfunctional mitochondria. Random TEM image of mitochondria was blindly acquired and quantified. Data are means ± SD, and P values were quantified using one-way ANOVA with Tukey's post hoc test. **P 0.01, ***P 0.001, and ****P 0.0001 were considered as significant. Credit: Science Advances (2023). DOI: 10.1126/sciadv.adf9284" alt="Inhibiting the biological crosstalk of autophagy and mitochondrial function underlying pancreatic ductal adenocarcinoma" src="/Editor/ebioueditorasp/asp/upload/image/20230506/16833364926323196.jpg" 自噬的丧失损害了PDAC的线粒体微结构
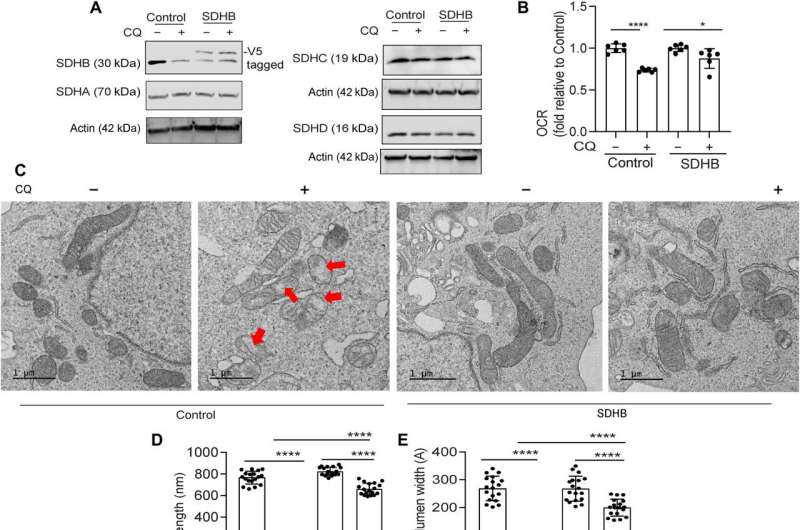
img title="Ectopic SDHB rescues the mitochondrial dysfunction upon autophagy inhibition in PDAC. PDAC cells expressing SDHB and control vector were treated with CQ followed by immunoblotting for the indicated proteins (A) and analyzed for (B) OCR (combined data from n = 2 experiments). (C) Representative TEM images of cells are shown in situation similar to (A) followed by mitochondrial crista length (D; n = 18 unique cristae for all groups) and lumen width (E; n = 18 unique cristae for all groups) determination. Red arrows in (C) indicate the typical dysfunctional mitochondria. ATG5 was suppressed in SDHB overexpression and control PDAC cells for immunoblotting of indicated proteins (F). Under conditions similar to (F), cell proliferation (G; combined data of n = 5 experiment) and OCR was determined (H; combined data of n = 2 experiments). Data are means ± SD, and P values were quantified using one-way ANOVA with Tukey's post hoc test. *P 0.05, **P 0.01, ***P 0.001, and ****P 0.0001 were considered as significant. Credit: Science Advances (2023). DOI: 10.1126/sciadv.adf9284" alt="Inhibiting the biological crosstalk of autophagy and mitochondrial function underlying pancreatic ductal adenocarcinoma" src="/Editor/ebioueditorasp/asp/upload/image/20230506/16833364921975416.jpg" 异位SDHB可缓解PDAC自噬抑制后的线粒体功能障碍
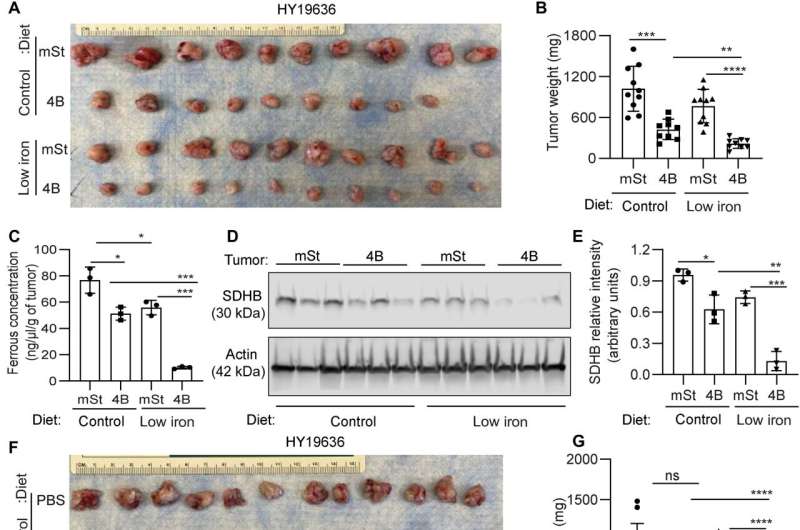
img title="Combination of iron restricted diet and autophagy inhibition provides a therapeutic benefit in PDAC. (A) Murine PDAC cells (HY19636) bearing intact autophagy (mSt) or inhibited autophagy (4B) were orthotopically implanted in syngeneic mice fed with doxycycline (625 mg/kg) diet containing control (220 ppm) or low iron (4 to 6 ppm). Mice were euthanized after 24 days of implantation, and tumor images are shown (A; n = 10, 9, 10, and 10 from top to bottom) along with tumor weights (B). (C) The ferrous concentration of different tumors indicated in (A) was analyzed from three randomly selected tumors of each group. (D) SDHB expression levels were determined by performing immunoblot analysis on these tumors, and their relative quantification was performed (E). B6 mice bearing syngeneic PDAC cells were treated with CQ or PBS, fed with control or low-iron diet, and were euthanized 24 days after implantation. Tumor images are shown (F; n = 12, 10, 12, and 12 from top to bottom) along with tumor weights (G). (H) Ferrous concentration in tumors of the indicated groups was determined (n = 3). (I) SDHB expression level was assessed by immunoblotting on these tumors, and their relative quantification was performed (J) (n = 3). Data are means ± SD, and P values were quantified using one-way ANOVA with Tukey's post hoc test. *P 0.05, **P 0.01, ***P 0.001, and ****P 0.0001 were considered as significant. Credit: Science Advances (2023). DOI: 10.1126/sciadv.adf9284" alt="Inhibiting the biological crosstalk of autophagy and mitochondrial function underlying pancreatic ductal adenocarcinoma" src="/Editor/ebioueditorasp/asp/upload/image/20230506/16833364932171893.jpg" 铁限制饮食和自噬抑制相结合对PDAC有治疗作用